
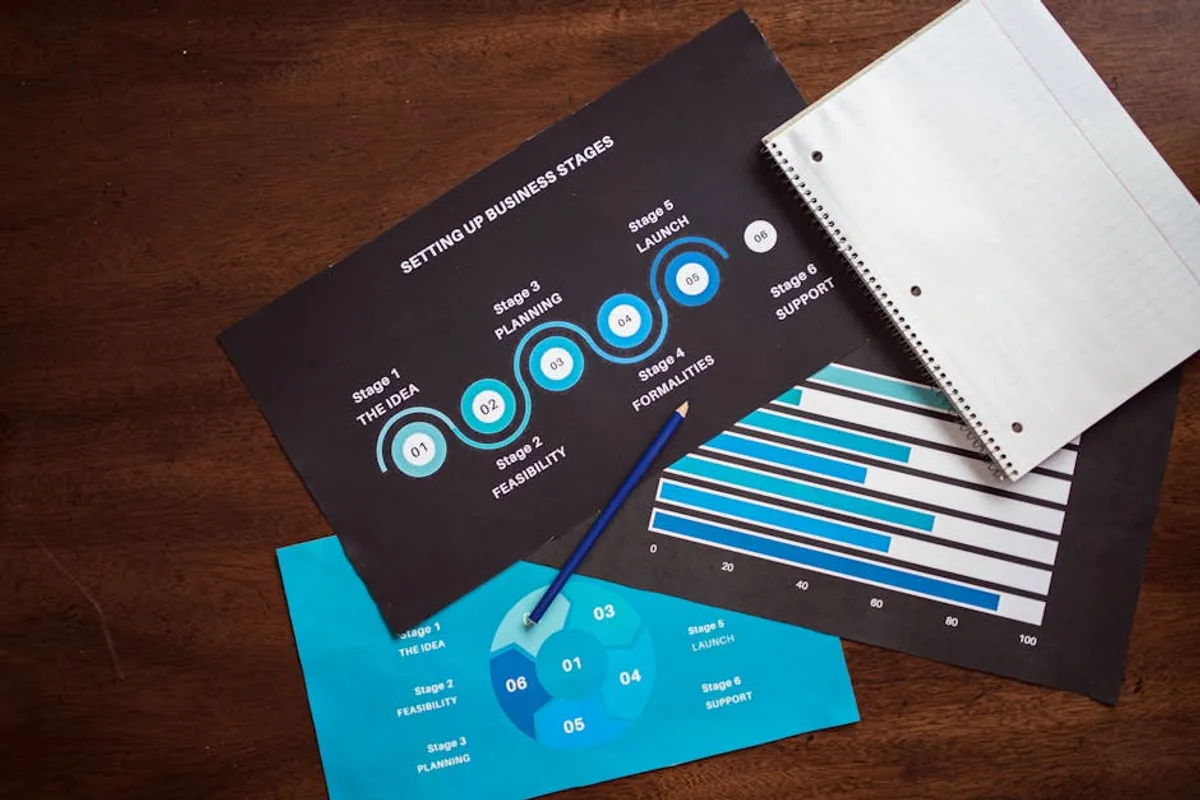
Infographics, when deployed strategically, serve as more than just visual adornments for a website; they function as potent tools for communicating complex data, enhancing user engagement, and driving specific commercial outcomes. For SEO professionals, marketers, and site owners, the decision to incorporate infographics should stem from a clear understanding of their capacity to improve content readability, extend dwell time, attract backlinks, and ultimately, support conversion goals. This guide outlines how to integrate and optimize infographics to maximize their impact across your digital properties.
Designing Infographics for Web Effectiveness
An effective infographic for web use prioritizes clarity, conciseness, and scannability. Unlike print-focused designs, web infographics must cater to varying screen sizes and user attention spans. Key design considerations include:
- Data Accuracy and Sourcing: Every data point must be verifiable. Include discreet but clear citations for all statistics, reports, or studies. This builds trust and authority.
- Visual Hierarchy: Guide the user's eye through the information with a logical flow. Use size, color, and placement to emphasize key takeaways and direct attention from general concepts to specific details.
- Readability: Choose fonts that are legible on digital screens, even at smaller sizes. Ensure sufficient contrast between text and background colors. Avoid overly decorative fonts that hinder quick comprehension.
- Mobile Responsiveness: Design for adaptability. While a single large image can be challenging on mobile, consider breaking down complex infographics into smaller, sequential visuals, or ensuring the primary message is clear even when scaled down. Vector graphics (SVG) are often preferable for scalability.
- Brand Consistency: Align the infographic's color palette, typography, and visual style with your existing brand guidelines. This reinforces brand identity and professionalism.
Optimizing Infographics for Search Engines
Integrating infographics without proper SEO consideration diminishes their potential. Optimization ensures search engines understand the visual content and can rank it appropriately:
Image File Optimization
Large image files slow down page load times, negatively impacting user experience and SEO. Compress infographic images without significant quality loss. Use modern formats like WebP where supported, or JPG for photographs and PNG for graphics with transparency. Aim for file sizes under 200KB for typical web use.
Descriptive Alt Text and Captions
Alt text (alternative text) provides a textual description of the image for screen readers and search engines. It is crucial for accessibility and SEO. Craft concise, descriptive alt text that accurately summarizes the infographic's content, incorporating relevant keywords where natural. For example, instead of "infographic.jpg", use "Infographic: 2023 Digital Marketing Trends for Small Businesses". Captions offer additional context directly below the image, enhancing user understanding and providing another opportunity for keyword integration.
Contextual On-Page Content
An infographic should always be supported by surrounding text. The page content should introduce the infographic, elaborate on its key points, and provide further analysis or actionable insights. This text helps search engines understand the topic in depth and provides a rich environment for keyword targeting that the image alone cannot achieve. Avoid simply embedding an infographic without any explanatory text.
Embed Codes for Link Building
To encourage sharing and backlink acquisition, provide an embed code for your infographic. This code allows other websites to easily display your infographic on their own pages, automatically linking back to your original source. Include clear instructions on how to use the embed code, typically offering both HTML and Markdown options. This tactic directly contributes to your off-page SEO efforts by generating high-quality inbound links.
Social Sharing Functionality
Integrate prominent social sharing buttons directly alongside your infographic. Make it easy for users to share the visual content across platforms like LinkedIn, X (formerly Twitter), and Pinterest. Infographics are inherently shareable, and facilitating this process extends their reach and potential for virality.
Pro Tip: When designing your infographic, consider including your website's URL or logo subtly within the graphic itself. This ensures that even if the infographic is shared without its embed code or direct attribution, your brand still receives recognition and potential referral traffic.
Strategic Placement and Promotion
The effectiveness of an infographic is also tied to where and how it is presented and distributed:
Optimal Placement on Your Website
Place infographics where they add the most value to the user journey. This often means within blog posts that discuss data-heavy topics, on product or service pages to simplify complex features, or on landing pages to summarize benefits. Ensure the infographic is positioned prominently, ideally above the fold or immediately after an introductory paragraph that sets the context.
Leveraging Infographics in Content Marketing
Beyond direct website embeds, infographics can be repurposed for various content marketing initiatives:
- Email Campaigns: Include snippets or a link to the full infographic in newsletters to drive traffic back to your site.
- Guest Posts: Offer your infographic as a visual asset for relevant guest posts on industry blogs, securing valuable backlinks.
- Paid Promotion: Use infographics in social media ads or sponsored content to capture attention and convey information quickly.
- Webinars/Presentations: Break down infographics into slides for use in presentations, offering a dynamic way to share data.
Measuring Infographic Performance
To justify the resource investment, track key metrics:
- Page Views & Dwell Time: Monitor the specific page hosting the infographic. Increased dwell time suggests users are engaging with the content.
- Social Shares & Mentions: Track how often the infographic is shared on social media and if it generates brand mentions.
- Backlinks: Use backlink analysis tools to identify new links pointing to the infographic's page.
- Referral Traffic: Analyze traffic from sites that have embedded or linked to your infographic.
- Conversion Rates: If placed on a landing page, measure how the infographic contributes to form submissions, downloads, or sales.
Actionable Infographic Deployment Checklist
Before publishing, run through this checklist to ensure your infographic is primed for impact:
- Is the data accurate and clearly sourced?
- Is the design visually appealing, easy to read, and brand-consistent?
- Is the image file optimized for web (size, format)?
- Does it have descriptive alt text and a clear caption?
- Is it surrounded by relevant, keyword-rich textual content?
- Is an embed code provided for easy sharing and backlinking?
- Are social sharing buttons prominently displayed?
- Is the infographic placed strategically on a relevant page?
- Do you have a plan for promoting it beyond your website?
- Are tracking mechanisms in place to measure its performance?
Frequently Asked Questions About Infographics
Q: How long should an infographic be?
A: There's no fixed rule, but for web use, shorter is often better. Aim for a length that covers the topic comprehensively without becoming overwhelming, typically equivalent to 800-1500 words of text. Mobile-first design often favors breaking down long infographics into scrollable sections or a series of smaller, related images.
Q: Can infographics hurt SEO if not optimized?
A: Yes. Large, unoptimized image files can significantly slow page load times, which negatively impacts user experience and search rankings. Additionally, without proper alt text and surrounding contextual content, search engines may struggle to understand the infographic's relevance, diminishing its SEO value.
Q: What types of information are best suited for infographics?
A: Infographics excel at presenting complex data, statistics, step-by-step processes, comparisons, timelines, and hierarchical information. They are particularly effective when you need to simplify an abstract concept, illustrate a trend, or make a compelling argument with data.